myCSG © |Area: TFL| Concept: FGN : Figures: Generic | Lesson: LBAR101 : Bar Chart of Seroconversion |
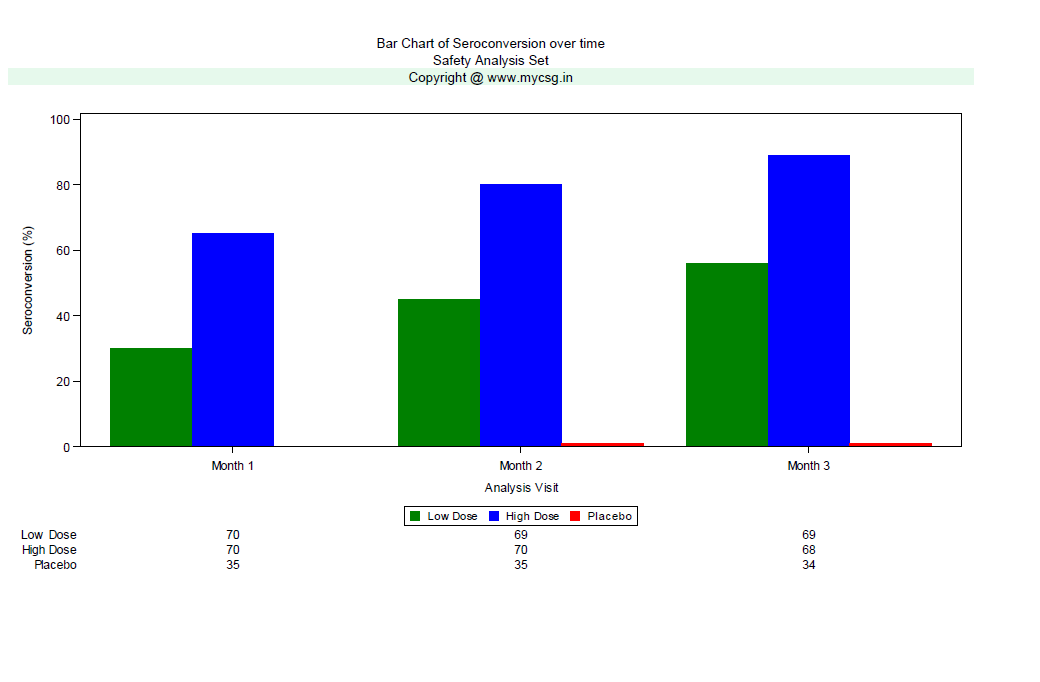
Bar chart over time using proc template
Comparison of percentage across three treatment groups
Display the number of subjects contributing to that visit within each treatment at the bottom of the graph
Lesson description will be added soon
Comparison of percentage across three treatment groups
Display the number of subjects contributing to that visit within each treatment at the bottom of the graph
Lesson description will be added soon
Complete SAS code to generate the output is available for registered users!
Already registered! Login
Not registered, you can signup here! Signup
Dont want to register?
You can directly purchase this lesson (code+input data) here
Already registered! Login
Not registered, you can signup here! Signup
Dont want to register?
You can directly purchase this lesson (code+input data) here
You can purchase this lesson (code+input data) here
If you are looking to purchase subscription for full access to data and programs for all lessons (TASKS+SDTM+ADaM+TFLs), you can send us a message on +91-7330--77--66--49-- on Whatsapp.
R data is available only for R subscribers.
You can contact us on +91-7330--77--66---49 for purchasing subscription to R programs and data
You can contact us on +91-7330--77--66---49 for purchasing subscription to R programs and data
R codes are available only for R subscribers.
You can contact us on +91-7330--77--66---49 for purchasing subscription to R programs and data
You can contact us on +91-7330--77--66---49 for purchasing subscription to R programs and data