In clinical trials, the participants are randomly allocated to either test drug or comparator group
We will have different groups of subjects based on the number of treatments or treatment combinations being studied in the trial
In parallel arm study, a subject will only receive the treatment to which he/she is randomized to
To assess if the subject characteristics are similar across different treatment groups, we create summary reports
Subject characteristics can be of numeric type (age, baseline BMI, etc) or categorical type(Sex, Race etc)
For numeric or continuous variables, data is summarized in terms of sample size, number of records with missing data, mean, standard deviation, quartiles (q1, median(q2), q3), minimum and maximum etc
These descriptive statistics are obtained for each group so that a comparison can be made between the groups
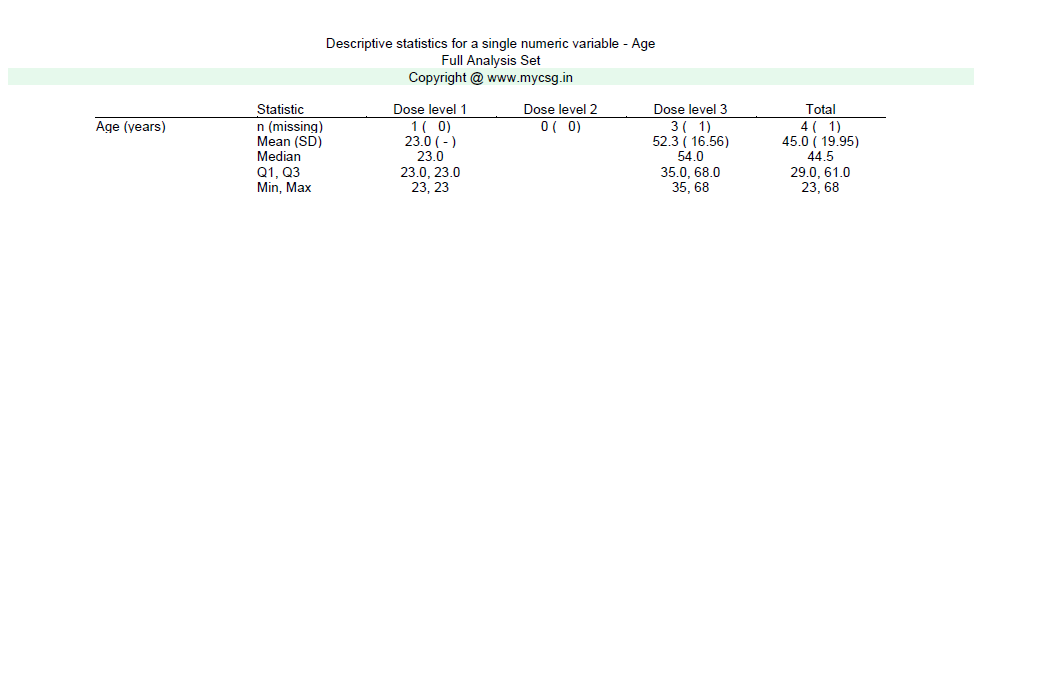
Below is a table summarizing the age value and the results are presented in a tabular format with different treatments side by side for easy comparison
Descriptive statistics for Age variable
Full Analysis Set
Statistic
Dose level 1
Dose level 2
Dose level 3
Total
Age (years)
n (missing)
xx (xx)
xx (xx)
xx (xx)
xx (xx)
Mean (SD)
xx.x (xx.xx)
xx.x (xx.xx)
xx.x (xx.xx)
xx.x (xx.xx)
Median
xx.x
xx.x
xx.x
xx.x
Q1, Q3
xx.x, xx.x
xx.x, xx.x
xx.x, xx.x
xx.x, xx.x
Min, Max
xx, xx
xx, xx
xx, xx
xx, xx
Points to note in this kind of summary table
The variable being analyzed is called an analysis variable.
In the above example, age is the analysis variable
The variable which contains the treatment group information is called a 'grouping' or 'class' or 'by' variable
In the above example, we are creating a summary to compare different 'dose levels' - the variable that contains the 'dose level' of a subject will be called a 'class' variable
If we follow ADaM standard, planned or actual treatment variables (TRT01P, TRT01A etc.) will be used as 'class' variables
We need to check the different descriptive statistics that are being presented
In this example, n, missing, mean, standard deviation, q1, median, q3, minimum and maximum are being presented
The number of decimal values presented for different statistics are to be noted.
Generally,
mean, median, q1, q3 will be presented to 1 additional decimal place than in data
minimum and maximum will be presented to the same number of decimals as in data
standard deviation will be presented to 2 additional decimal places than in data
Some of the statistics are presented side by side
n (missing)
Mean (SD)
Q1, Q3
Min, Max
Treatment groups are presented as columns in the table
Statistics are presented as rows in the table with a specific order
How do we program this in SAS?
There are multiple ways in which descriptive statistics for numeric variables can be obtained in SAS
Most commonly used procedures for this purpose are proc means or proc summary
Both proc means and proc summary can produce output to the output window or to an output dataset
We need extensive transformations on the obtained numbers reported by these procedures
control the number of decimals to be presented for different statistics
concatenate two different statistics into a single row
use descriptive labels for the statistics etc
We need to use a combination of data steps, proc steps (like sort, transpose, report etc) to produce the final output
Complete SAS code to generate the output is available for registered users!
Already registered! Login Not registered, you can signup here! Signup
Dont want to register?
You can directly purchase this lesson (code+input data) here
You can purchase this lesson (code+input data) here
If you are looking to purchase subscription for full access to data and programs for all lessons (TASKS+SDTM+ADaM+TFLs), you can send us a message on +91-7330--77--66--49-- on Whatsapp.
R data is available only for R subscribers.
You can contact us on +91-7330--77--66---49 for purchasing subscription to R programs and data
R codes are available only for R subscribers.
You can contact us on +91-7330--77--66---49 for purchasing subscription to R programs and data